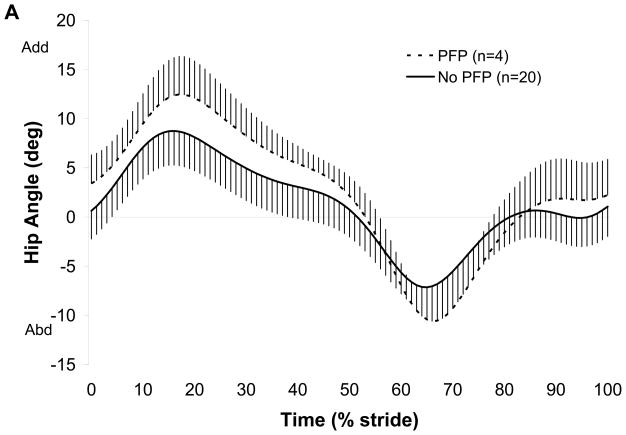
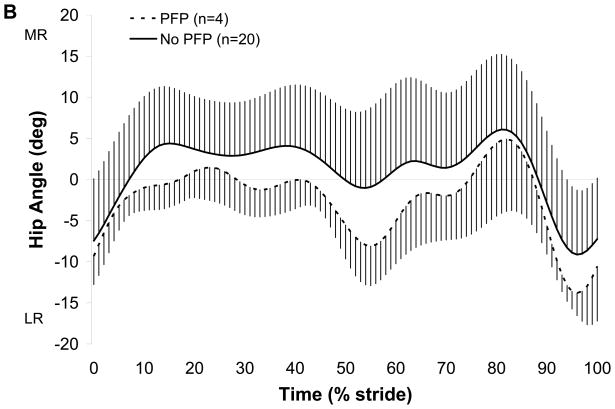
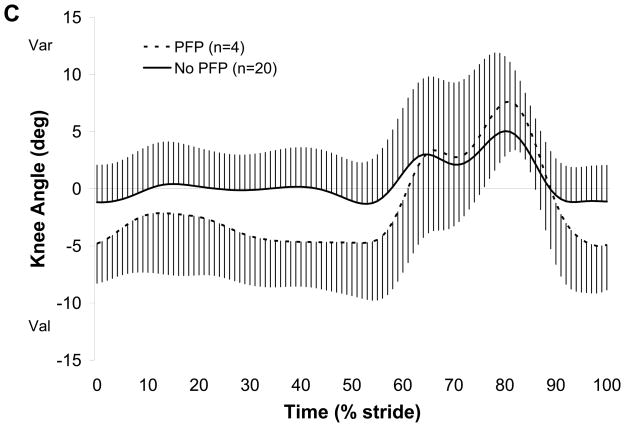
FIGURE 3. Subgroup analysis.
Ensemble averaged kinematic curves for free speed walking. A: Hip frontal plane angle, B: Hip transverse plane angle, C: Knee frontal plane angle. Time axis is expressed as a percentage of one stride. Thick lines represent the mean of n subjects; vertical error bars represent one standard deviation. Abd=abduction, Add=adduction, MR=medial rotation, LR=lateral rotation, Var=varus, Val=valgus. *indicates hip adduction at PkMOM and knee valgus at MxExt were greater in the PFP group, p <.05.


