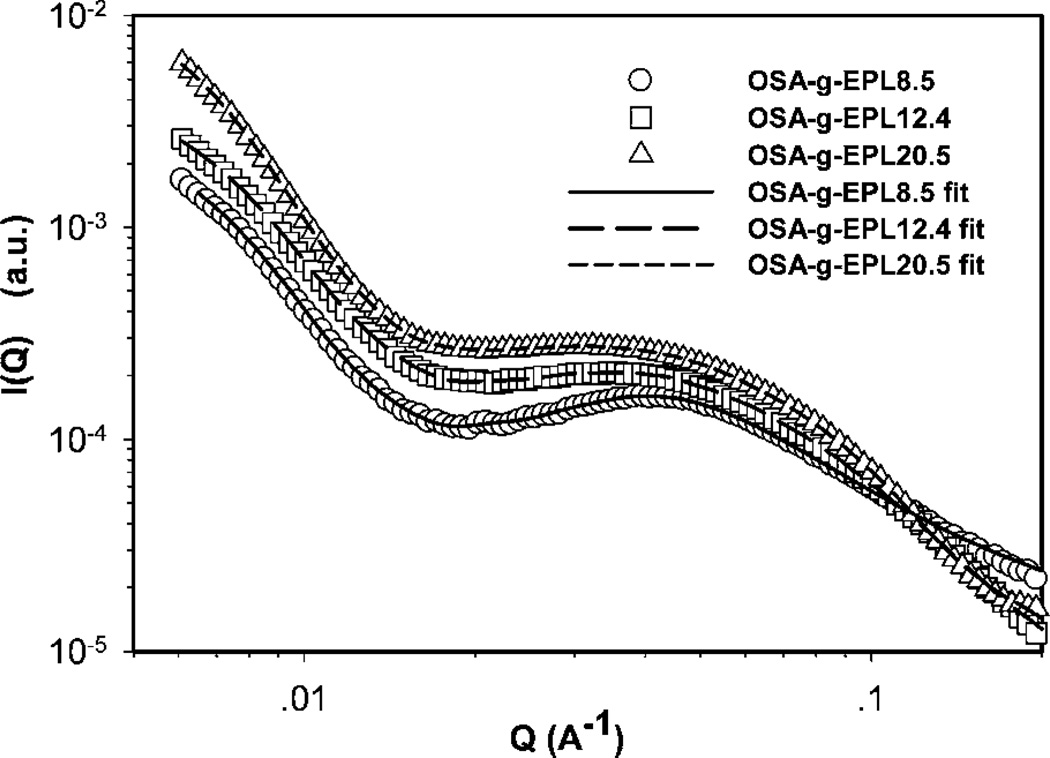
Fig. 2.
Small-angle X-ray scattering profiles of modified ε-polylysine with different degrees of substitution. The solid line (OSA-g-EPL8.5), long dash line (OSA-g-EPL12.4), and short dash line (OSA-g-EPL20.5) are fitted curves obtained from inversed Fourier transform of pair distribution function (PDF) by Irena package in Igor Pro software. PDF curves were normalized for better comparison.

