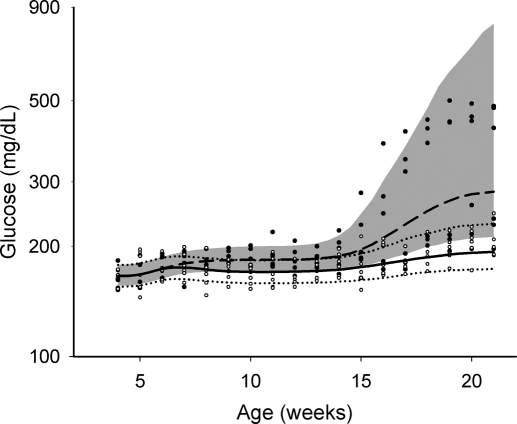
Fig. 4.
Visual predictive check for blood glucose with aging for GK rats. Experimental measurement for natural disease group (●) and salsalate-fed group (○): 10 to 90% percentile (shaded area) and 50% percentile (dashed line) for the natural disease group; 10 to 90% percentile (dotted lines), and 50% percentile (solid line) for the salsalate-fed group.

