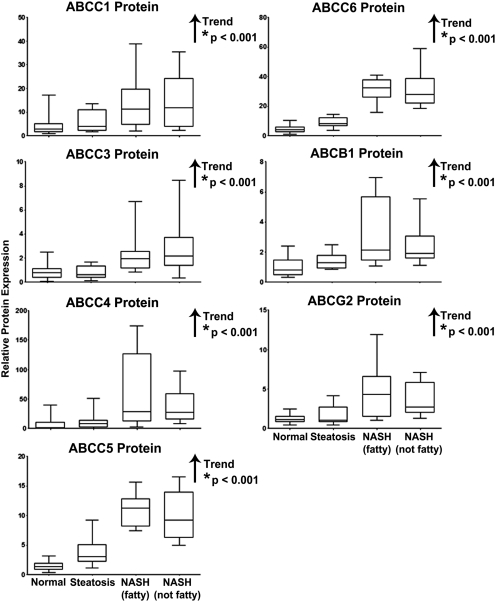
Fig. 4.
Relative protein expression of ABC transporters in human NAFLD. Relative protein levels of ABCC1, ABCC3–6, ABCB1, and ABCG2 in human liver whole-cell lysate preparations staged as normal, steatotic, NASH (fatty), and NASH (not fatty) were determined by densitometric analysis of all samples and expressed as relative to control protein (pan-cadherin). Arrows, increasing or decreasing trend with NAFLD progression. *, significant trends (p ≤ 0.05).

