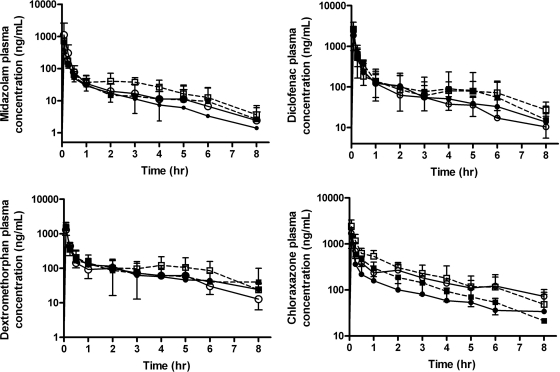
Fig. 2.
Time course of plasma concentrations obtained for midazolam, diclofenac, dextromethorphan, and chlorzoxazone from 0 to 8 h after intravenous bolus of 0.2 mg/kg midazolam, 0.5 mg/kg diclofenac, 0.5 mg/kg dextromethorphan, and 0.5 mg/kg chlorzoxazone. – – –, hypothermia groups; ——, normothermia groups. ●, sham normothermia; ■, sham hypothermia; ○, CA normothermia; □, CA hypothermia.

