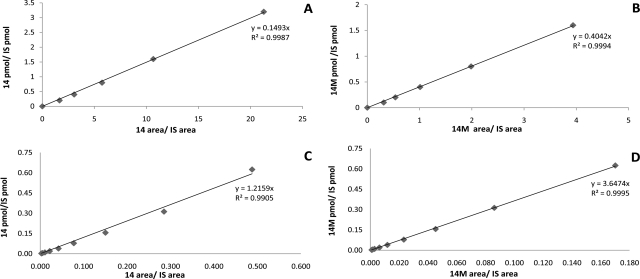
Fig. 1.
Representative standard curves. The curves were constructed by plotting the ratio of area of analyte to internal standard (IS) against the ratio of concentration of analyte to IS. A, standard curve of substrate 14 versus IS using electrospray ionization. B, standard curve of metabolite 14M versus IS using electrospray ionization. C, standard curve of substrate 14 versus IS using CSI. D, standard curve of metabolite 14M versus IS using CSI.

