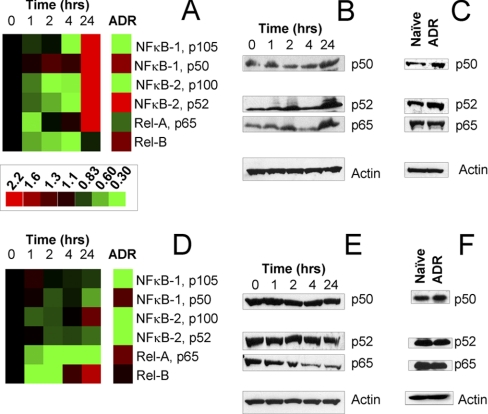
Fig. 2.
Quantification of nuclear factor-κB Survival signaling in naïve, drug treated, and melphalan resistant myeloma cells. NFκB-1, NFκB-2, RelA, and RelB expression were measured with LC-MRM at 0, 1, 2, 4, and 24 h time points after administration of 25 μm melphalan to naïve MM cells growing in culture; protein expression is also quantified in isogenic cell lines with acquired drug resistance (ADR). Ion signals are normalized using spiked SIS peptides; data are plotted relative to the pretreatment control (0 h). Heat maps (A and D) are shown for comparison of naïve MM cells both before and after treatment to cells that have acquired drug resistance; green indicates down-regulation and red shows up-regulation in protein expression. The scale bar applies to both panels. LC-MRM data comparing RPMI-8226 and 8226/LR5 cells (A) are confirmed with Western blotting for NFkB-1 p50, NFkB-2 p52, and Rel-A during drug response (B) and in acquired drug resistance (C). Similar data are shown for naïve U266 and drug-resistant U266/LR6 cells (D–F).

