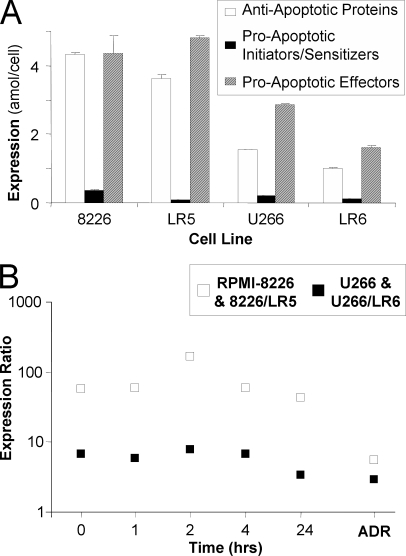
Fig. 4.
Examining the balance of pro-apoptotic and anti-apoptotic protein expression. In each cell line, the sum of the expression levels of anti-apoptotic proteins (white bars), pro-apoptotic initiators and sensitizers (black bars), and pro-apoptotic effectors (diagonally striped bars) are compared (A). In addition, the ratio of Mcl-1 to Bim is plotted (B) to illustrate the potential of LC-MRM to explore relationships between individual apoptotic proteins. Data are plotted on a log scale for drug response in RPMI-8226 (white) and U266 (black); ratios calculated for protein expression in 8226/LR5 (white) and U266/LR6 (black) are also shown for comparison.

