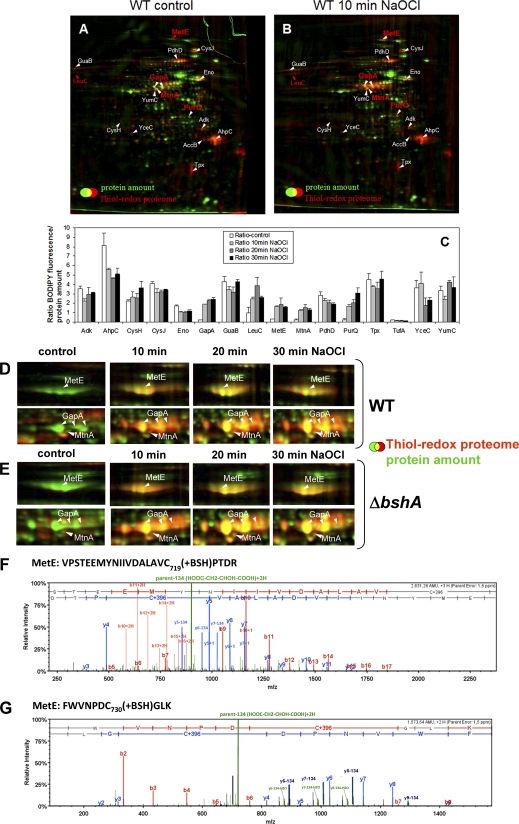
Fig. 5.
ABC. The thiol-redox proteome (red) in comparison to the protein amount image (green) at control conditions (A) and after exposure to 50 μm NaOCl (B) in the wild type. Reduced protein thiols in cell extracts were alkylated with IAM followed by reduction of oxidized protein thiols with TCEP and labeling with BODIPY FL C1-IA. Proteins with reversible thiol-modifications in the control and NaOCl redox proteome are labeled in white and newly oxidized proteins in NaOCl-treated cells are labeled in red. The oxidized proteins were identified by MALDI-TOF-TOF MS/MS as shown in detail in supplemental Fig. S1A–P. C, The fluorescence/protein amount ratios are quantified as oxidation ratios at control conditions (control) and 10, 20, and 30 min after exposure to 50 μm NaOCl stress as shown in the diagram.
DEFG. Close-ups of the main NaOCl-sensitive proteins MetE and GapA in the thiol-redox proteome of the wild type (D) and bshA mutant (E) and CID MS/MS spectra of the S-bacillithiolated Cys719 and Cys730 peptides of MetE (F, G). Figs. D and E show sections of reversibly oxidized proteins after NaOCl stress in the thiol-redox proteome (red) in comparison to the protein amount image (green) at control conditions (co) and 10, 20, and 30 min after exposure to 50 μm NaOCl. Figs. F and G show the CID MS/MS spectra of the S-bacillithiolated Cys719-and Cys730-peptides of MetE identified in the wild-type proteome using LTQ-Orbitrap-Velos mass spectrometry as described in the Methods section. The MS/MS spectra show the characteristic abundant precursor ions that have lost malate indicated by parent-134 (HOOC-CH2-CHOH-COOH). The Xcorr and ΔCn scores and peptide masses are listed in Table II and the corresponding b and y fragment ion series for the modified peptides are given in detail in supplemental Fig. S3B.

