Fig. 1.
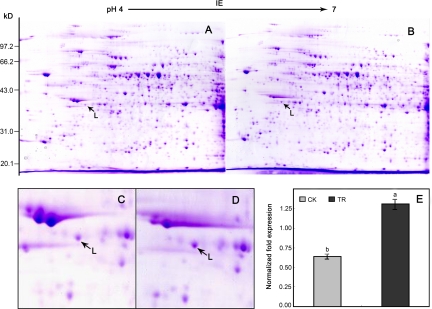
Identification of proteins associated with chilling stress. Proteins were extracted from control treatment (A) and chilling stressed (B) BY-2 cell culture samples and separated using 2-DE. Representative gel images from control treatment cell culture (C) and chilling stressed cell culture (D) are shown. The protein spot L was up-regulated by chilling treatment. mRNA level of NtLEA7-3 gene was analyzed by qRT-PCR (E). The relative gene expression was evaluated using comparative Ct method taking EF1-α as the reference gene. The log2 values of the ratio of the gene expression of NtLEA7-3 to EF1-α in chilling stressed sample (TR) and the control treatment samples (CK) are plotted. Data are the average of four experiments for three test samles and analyzed using Student's t test (p ≤ 0.05). Error bars represent S.D. The lowercase letters indicate values, with “a” being the higher, and “b” being the lower value.

