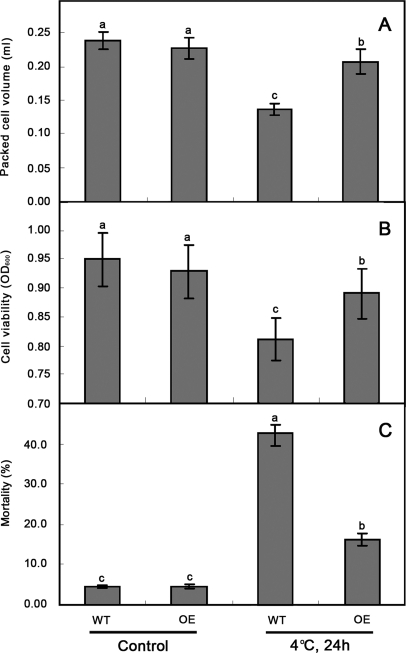
Fig. 6.
Chilling tolerance of suspension-cultured cells estimated by the packed cell volume (PCV) (A), TTC reduction (B) and mortality (C). Two grams of cells (fresh weight) at late log phase was transferred to fresh medium and grown at 26 °C for 24 h before chilling exposure. Aliquots of 1 ml cell culture each containing about 30 mg cells (fresh weight) were sampled to determine chilling tolerance. WT: Wild type cells; OE1–3: Different transgenic cell lines. Each data are the means of four replicates and error bar represents the mean and standard deviation of four experiments. Data are the average of four experiments for three test samples and analyzed using Student's t test (p ≤ 0.05). Error bars represent S.D. The lowercase letters indicate values, with “a ” being the highest, and “c ” the lowest value. The same letters within a column mean that no significant differences exist between the numbers.

