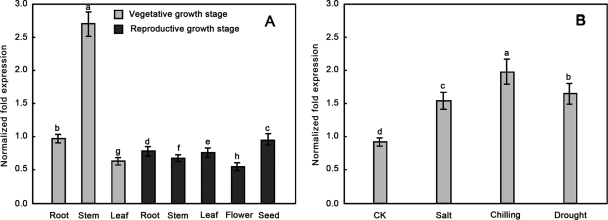
Fig. 7.
Expression profile analysis of NtLEA7-3. The relative gene expression was evaluated using comparative Ct method taking EF1-α (Accession No. DQ785808) as the reference gene. A, The log2 values of the ratio of the gene expression of NtLEA7-3 to EF1-α in the leaf, stem, root, flower, and seed samples are plotted. B, The log2 values of the ratio of the gene expression of NtLEA7-3 to EF1-α in salt, chilling, drought stressed and control samples are plotted. Data are the average of four experiments for three test samles and analyzed using Student's t test (p ≤ 0.05). Error bars represent S.D. The lowercase letters indicate values, with “a” being the highest, “h” and “d” being the lowest value in Fig. 7A and 7B, respectively. The same letters within a column mean that no significant differences exist between the numbers.

