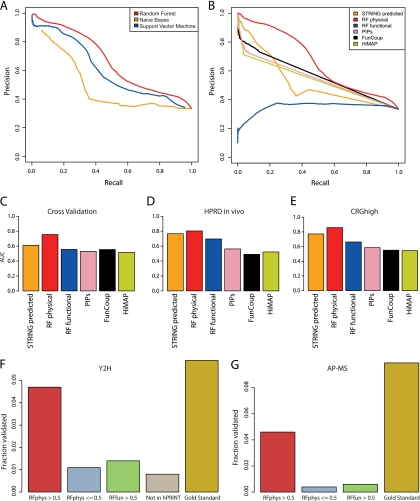
Fig. 2.
Evaluation of hPRINT. A, Precision-Recall curves for comparing Random Forest with naïve Bayesian prediction and Support Vector Machines (SVM). Radial basis factor was used as kernel for training the SVM. B, Precision-Recall curves for comparing Random Forests physical and functional scores with other published networks. The aim of the Random Forests machine learning was the de novo prediction of new interactions; hence, experimental interaction measurements were ignored. In the comparison we also removed experimental evidence from the other data sets. This was also necessary to avoid circular reasoning. Panels (A) and (B) are both based on fivefold cross validation using functional and noninteracting gene pairs (FUNSET and NONSET) together as the negative data set. Supplemental Fig. S1 shows equivalent plots when using other combinations of training and test sets. (C–E) Area Under the ROC Curve (AUC) for (C) fivefold cross validation, (D) using HPRD as an independent test set, E, using CRGhigh as an independent test set. The AUC of RFphys is significantly larger than in all the other cases (supplemental Fig. S2; supplemental Table S3). F, G, Experimental validation using yeast two-hybrid (F) and AP-MS (G). High scoring interactions (RFphys > 0.5) could be confirmed with much higher probability than interactions without any evidence (“Not in hPRINT”), low scoring interactions (RFphys < = 0.5), and interactions predicted to be only functional (RFfun > 0.5). The comparison with the reference set (“Gold Standard”) is a measure of the sensitivity of the assays. Note that in case of AP-MS we cannot define a “Not in hPRINT” set. See Supplementary Material for additional analyses of the experimental testing.

