Fig. 5.
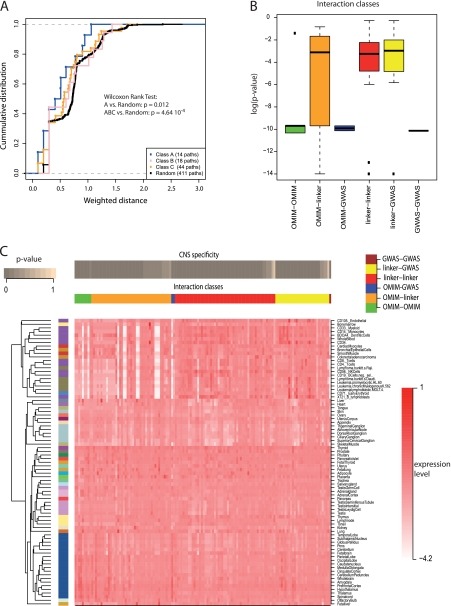
Prioritization of Alzheimer's disease candidate genes. A, Empirical cumulative distribution function (ECDF) for the weighted network distance between OMIM genes that are known to cause Alzheimer's and candidate genes with different confidence scores (classes A–C). The distance between class A genes and OMIM genes is generally closer than in case of the other two classes or random genes. The Wilcoxon rank test was used for comparing network distances against distances for random genes. B, Expression specificity in the central nervous system (CNS) quantified as the maximum specificity (minimum p value) of the two interacting genes (see Experimental Procedures for details). Box-plots of CNS specificity are shown for interactions connecting different types of genes (see labels at bottom). CNS specificity is generally higher (low p values) for interactions connecting two disease genes compared with interactions connecting disease genes with other genes. C, Expression specificity of individual interactions across tissues. Each column in the heat map shows the expression of one interaction across all tissues tested. CNS specificity is shown in the top bar. Interactions were grouped in different classes based on the disease classification of the genes (vertical bands, see color code on top). Tissues (rows) were grouped according to the BIOGPS classification (color code on the left). Dendrogram on the left shows clustering of tissues based on expression specificity of the interactions. Resulting groups agree with the BIOGPS classification. Equivalent figures for ALS and Parkinson's are shown in the supplement (supplemental Figs. S10–S13).

