Figure 2.
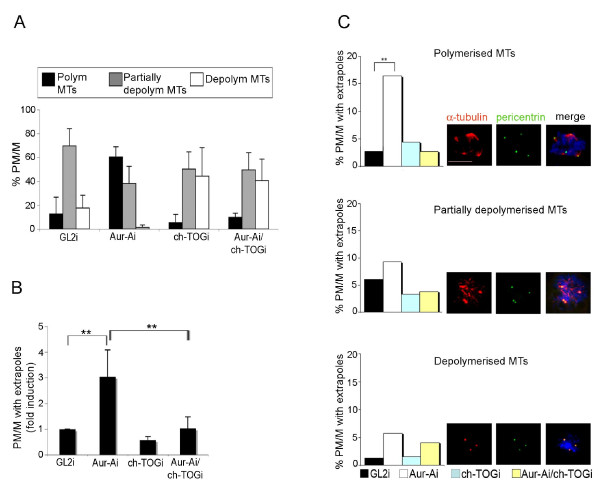
Aurora-A and ch-TOG modulate the stability of spindle MTs in opposite manners. A. Cells interfered (i) with the indicated siRNAs were incubated on ice for 15 minutes. Histograms represent the distribution of PM/M in the three MT categories identified in Figure 1A (at least 350 counted cells per condition, 2 experiments). B. PM/M with extrapoles were quantified (fold induction) in cultures interfered as indicated and incubated for 15 minutes of ice (at least 600 counted cells per condition, 2 experiments). C. Histograms represent the distribution of mitoses with fragmented spindle poles among the MT stability categories shown in Figure 1A (examples are shown in the IF panels). Around 700 PM/M were counted for each interference (2 experiments). Error bars represent s.d. **: p < 0.001, χ2 test. Scale bar: 10 μm.

