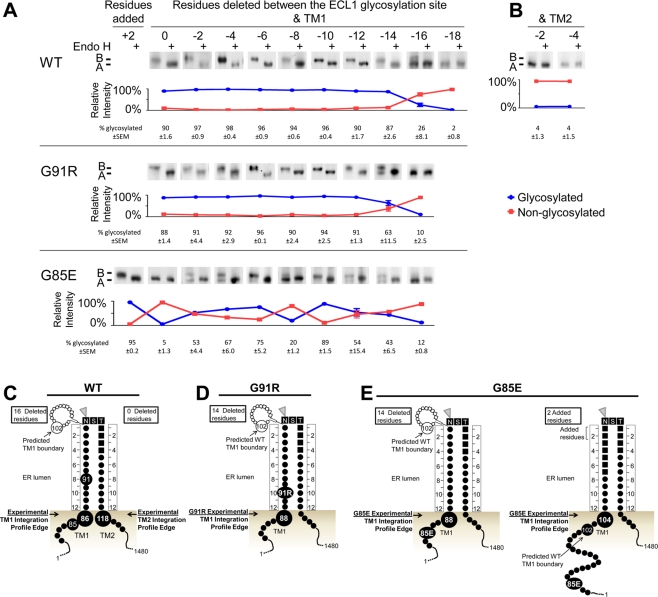
FIGURE 4:
Experimental TM1 ER luminal integration profile edges for WT and CF mutant CFTR. Core glycosylation requires a minimum of 12 residues between the artificial ECL1 site and the ER membrane. The distance between the ECL1 site and TM1 or TM2 was reduced by deleting residues proximal to the site. Core glycosylation analysis of WT, G91R, and G85E CFTR containing the artificial ECL1 site and lacking the ECL4 sites was performed by deletion of residues between the glycosylation site and TM1 (A) or between the glycosylation site and TM2 (B). Constructs were expressed in HeLa cells and analyzed by Western blot. Core glycosylation was detected by its removal with Endo H. Each image shows the core and nonglycosylated CFTR bands. The positions of nonglycosylated (band A) and core glycosylated (band B) CFTR are marked. Below each image, the percentage of glycosylated (blue) and nonglycosylated (red) protein from the untreated sample is shown after quantification, with the average and SEM displayed. Schematics of the experimentally identified ER integration profiles in WT (C) or G91R (D) and G85E (E) mutants.

