FIGURE 2:
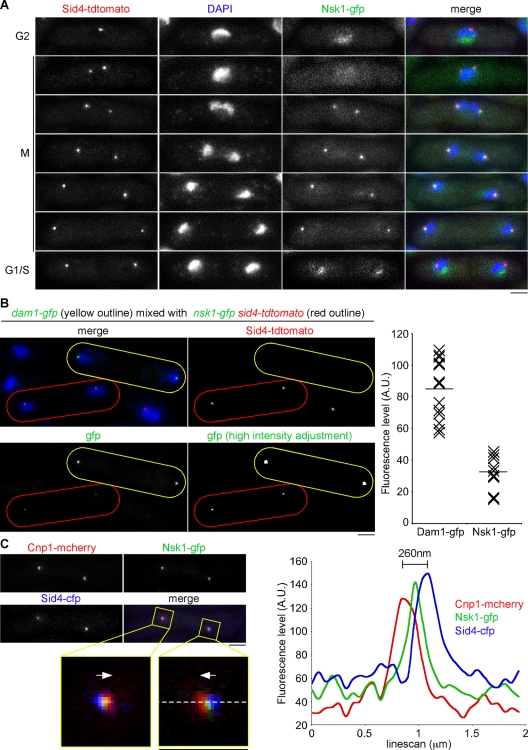
Nsk1 localizes at the kinetochore–SPB interface in a cell cycle–dependent manner. (A) Log-phase cultures of nsk1-gfp sid4-tdtomato cells were fixed and analyzed by fluorescence microscopy. A series of images of cells at different stages of the cell cycle are depicted. Scale bars: 2 μm. (B) Equal volumes of log-phase dam1-gfp (yellow outline) and nsk1-gfp sid4-tdtomato (red outline) cells were mixed and fixed. Left panels show a representative image containing both cell types. Bottom, right image shows the GFP channel with a high-intensity adjustment. Far right panel shows the fluorescence intensities of Dam1-gfp and Nsk1-gfp signals from these mixed-population experiments. Horizontal bars indicate the mean fluorescence levels. (C) Fluorescence levels over a 2-μm distance were calculated for the three channels in a nsk1-gfp cnp1-mcherry sid4-cfp cell. Top, left panel shows the cell under examination with the analyzed regions boxed (yellow). Enlargements are shown below. Arrows indicate the direction of the cell middle. The pixel line (white, dashed) used to measure fluorescence levels is shown. Right panel is a graph generated by this line scan.

