FIGURE 3:
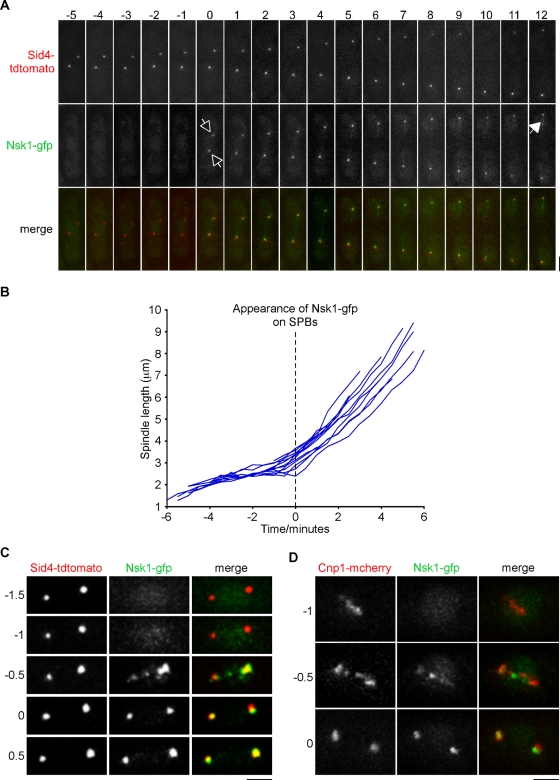
Nsk1 loading occurs at anaphase onset. (A) Log-phase cultures of nsk1-gfp sid4-tdtomato cells were grown on agar pads at 30°C and analyzed by fluorescence microscopy. A series of images of a mitotic cell at 1-min intervals is depicted. The time at which Nsk1 appears at the kinetochore–SPB junction (open arrows) and late anaphase B spindle (closed arrow) is highlighted. Scale bars: 2 μm. (B) Graph of spindle length against time for multiple nsk1-gfp sid4-tdtomato cells. Spindle length is the distance between two Sid4-tdtomato dots. Time zero corresponds to the appearance of Nsk1 at the pole. (C & D) Log-phase cultures of nsk1-gfp sid4-tdtomato (C) or nsk1-gfp cnp1-mcherry (D) cells were grown on agar pads at 30°C and analyzed by fluorescence microscopy. A series of images from two representative cells at 30 s intervals are depicted. Note that in each case Nsk1 appears before the end of anaphase A. Time 0 corresponds to the appearance of Nsk1 at the poles.

