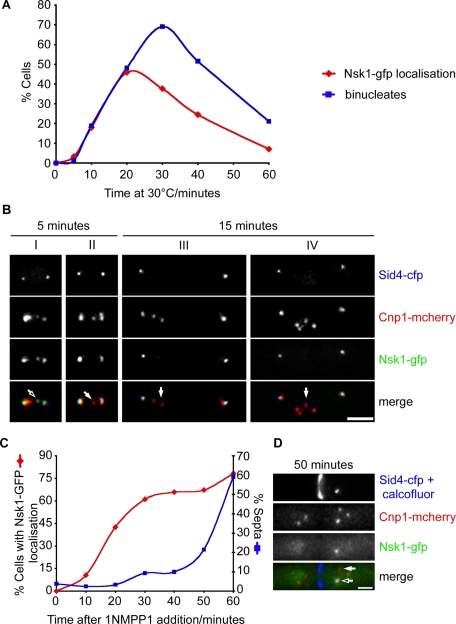
FIGURE 4:
Nsk1 associates to the kinetochore–spindle junction during anaphase B in the absence of microtubules. (A) Log-phase cultures of nda3-KM311 nsk1-gfp cnp1-mcherry sid4-cfp cells were arrested in mitosis by incubation at 18°C for 6 h. Following release at 30°C, cells were fixed and the percentage of cells with Nsk1 at SPBs (red diamonds) or two separated nuclei (blue squares) was analyzed by fluorescence microscopy. (B) Images of cells from the experiment in (A) either 5 min (cells I and II) or 15 min (cells III and IV) following release to the permissive temperature. Localization of SPBs (blue), kinetochores (red), and Nsk1 (green) are shown both separately and merged. Arrows highlight representative kinetochores with (open arrow) and without (closed arrows) Nsk1. Scale bars: 2 μm. (C) Log-phase cultures of nda3-KM311 ark1-as3 nsk1-gfp cnp1-mcherry sid4-cfp were arrested in mitosis by incubation at 18°C for 6 h. Following addition of 1NMPP1 and continued incubation at 18°C, cells were fixed at intervals and the percentage with SPB-associated Nsk1 (red diamonds) or septa (blue squares) was determined by fluorescence microscopy. (D) Images of a cell from the experiment in (C) 50 min after addition of 1NMPP1. Localization of SPBs (blue), kinetochores (red), and Nsk1 (green) are shown separately and merged. Arrows highlight representative kinetochores with (open arrow) and without (closed arrow) Nsk1.

