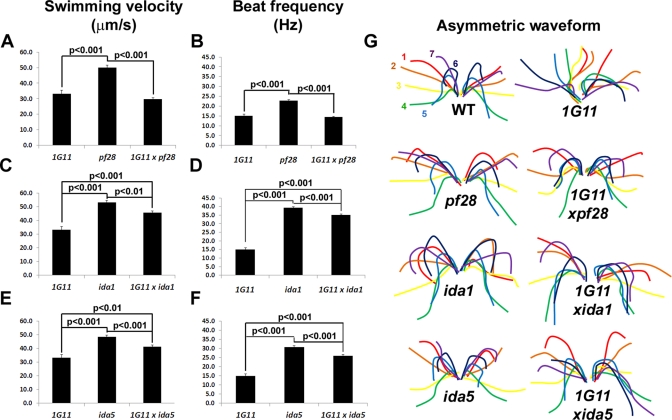
FIGURE 4:
Inner dynein arm double mutants have recovered motility parameters. Mean swimming velocities (A, C, E) and mean beat frequencies (B, D, F) of 1G11 compared with pf28 and 1G11xpf28 (A, B), ida1 and 1G11xida1 (C, D), and ida5 and 1G11xida5 (E, F). Black lines connect values with significant differences (determined by Student's t test); p values are noted. For swimming velocities: 1G11, n = 89; pf28, n = 92; 1G11xpf28, n = 79; ida1, n = 81; 1G11xida1, n = 93; ida5, n = 87; 1G11xida5, n = 94. For beat frequencies: 1G11, n = 99; pf28, n = 172; 1G11xpf28, n = 177; ida1, n = 165; 1G11xida1, n = 145; ida5, n = 170; 1G11xida5, n = 172. (G) Diagrams showing the progression of the asymmetric waveform of a representative cell from WT and each mutant strain as traced from a recorded video (see Materials and Methods). Numbers and colors represent the order of each flagellar position over time. The time between each flagellar position (color) is 0.004 s (WT), 0.006 s (ida1, 1G11xida1, ida5, and 1G11xida5), or 0.008 s (1G11, pf28, and 1G11xpf28).

