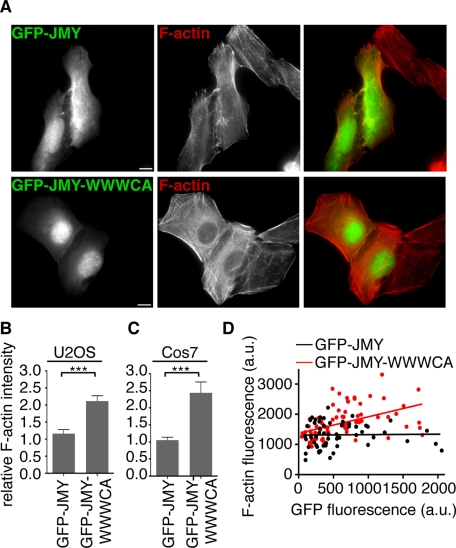
FIGURE 5:
Expression of JMY-WWWCA causes a global increase in cellular F-actin content, but expression of full-length JMY does not. (A) Top, GFP-JMY (green in merge on right) and F-actin (stained with Alexa 568–phalloidin; red in merge on right) in transfected and nontransfected U2OS cells. Bottom, GFP-JMY-WWWCA and F-actin in transfected and nontransfected U2OS cells. Scale bars, 5 μm. (B, C) Quantification of the ratio of F-actin staining intensity in transfected/nontransfected (B) U2OS or (C) Cos7 cells. Data are the mean ± SEM of three experiments with 25 cells examined per sample (***p < 0.001). (D) Graph of GFP-JMY or GFP-JMY-WWWCA fluorescence intensity vs. Alexa 568–phalloidin fluorescence intensities plotted for individual transfected U2OS cells. Data are from three experiments with 25 cells per experiment. Lines represent the best fit for each condition (linear regression analysis: for GFP-JMY-WWWCA, positive linear correlation with a slope of 0.5 ± 0.1, r2 = 0.22, p < 0.0001; for GFP-JMY, no correlation, r2 = 0.0003, p = 0.9).

