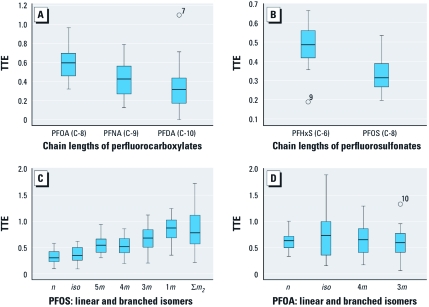
Figure 2.
TTE distributions for different-chain-length perfluorocarboxylates (A) and perfluorosulfonates (B) and for linear and branched PFOS (C) and PFOA (D) isomers. The upper and lower bounds of the boxes indicate the 75th and 25th percentiles, respectively, and the horizontal lines within the boxes indicate median values. The upper and lower limits of the whiskers indicate minimum and maximum values, respectively, and points above or below the whiskers indicate outlier values. In A, B, and D, the number attached to each outlier is the number of a specific sample.

