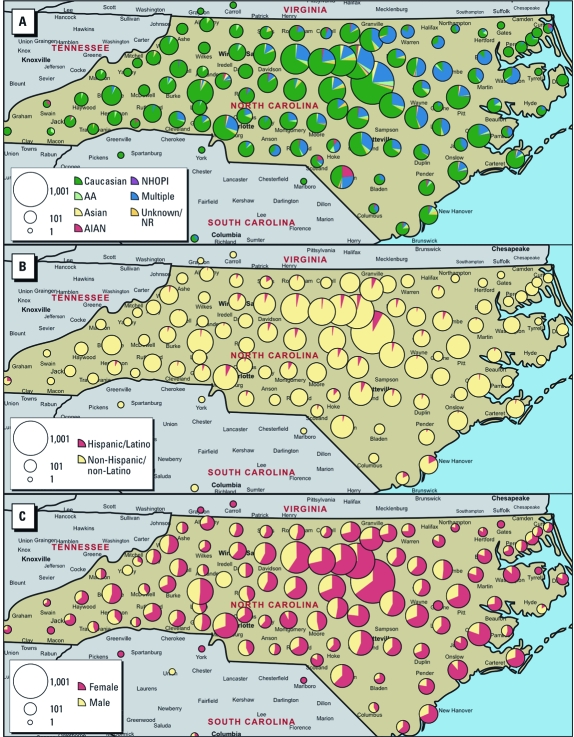
Figure 2.
Distribution of the recontactable EPR population in North Carolina by race (A), ethnicity (B), and sex (C). The size of each pie represents an estimate of the number of EPR subjects living in the region under the pie. Pie slices represent the proportions of subjects of different races (A), ethnicity (B), and sex (C). Abbreviations: AA, African American; AIAN, American Indian/Alaska Native; NHOPI, Native Hawaiian/other Pacific Islander; NR, not reported.

