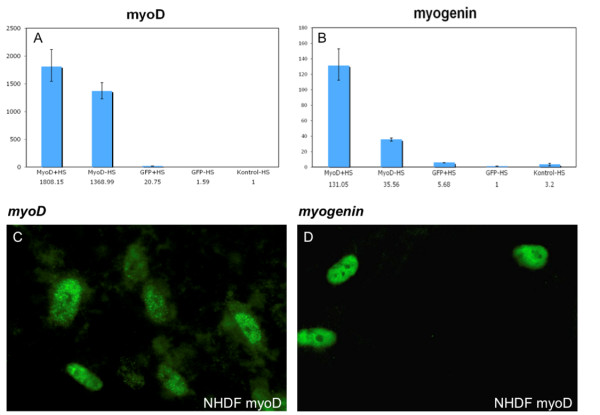
Figure 1.
Expression of myoD and myogenin in normal human dermal fibroblasts (NHDF). (A and B) The cells were cultured for 6 days before harvest for quantitative RT-PCR or (C and D) IF: myoD and myogenin expression relative to beta-actin. +HS indicate cells grown in low serum medium; -HS designates cells grown in standard DMEM medium. Control designates no transduction. (C and D) Immunofluorescence of myoD and myogenin proteins, respectively. Original magnification × 630.

