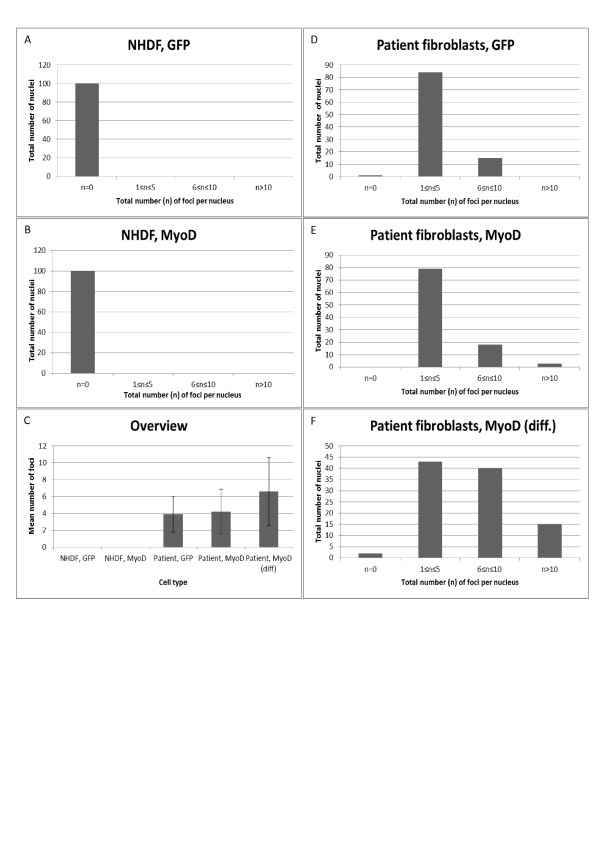
Figure 3.
Quantification of foci in DM1 patient cells and NHDF. (A and D) Fibroblasts were transduced with GFP or (B, E-F) myoD. Nuclear foci in 100 cell nuclei were counted for each sample. (A and B) NHDF cell nuclei contained no foci following tranduction with GFP or myoD. (D and E) PT cells transduced with GFP or myoD showed foci in cell nuclei. (F) Differentiated (myoD) patient fibroblasts displayed markedly changed morphology and exhibited an increase in the average as well as the maximum number of nuclear foci per cell.

