
Figure 3.
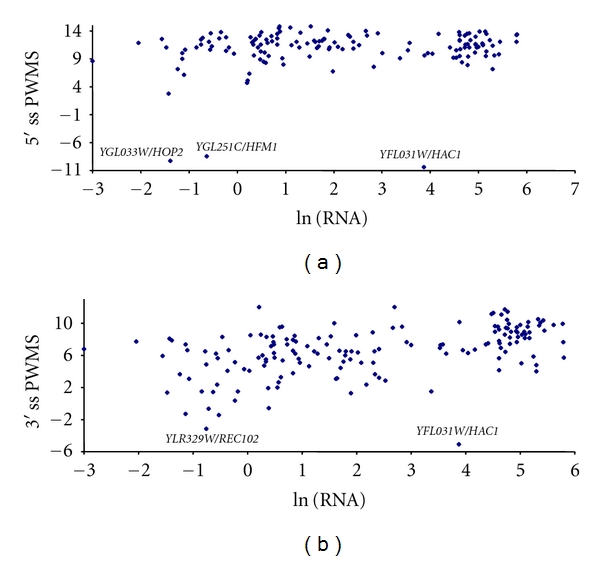
Relationship between splicing strength measured by position weight matrix score (PWMS) at 5′ (a) and 3′ (b) splice sites (5′ ss and 3′ ss) and gene expression measured by mRNA abundance [28]. The mRNA abundance is log transformed. A similar pattern is observed when the mRNA abundance from Holstege et al. [27] is used.