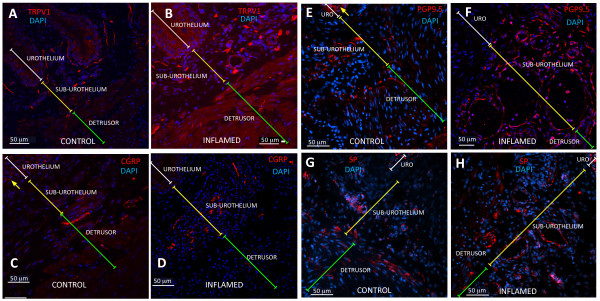
Figure 6.
Mouse bladder nerves. Representative photomicrographs illustrating distribution of IR for: TRPV1 (A-B), CGRP (C-D), PGP9.5 (E-F), and SP (G-H) in urinary bladders isolated from C57BL6 mice that received chronic PBS instillation (left panels) or chronic BCG instillation (right panels). White transversal bars indicate the urothelium, yellow bars indicate the sub-urothelium, and green bars indicate the detrusor smooth muscle. Yellow arrows indicate non-specific labeling of urothelial cells with PGP9.5 (F) and CGRP (C). See Figure 6 for quantification of IR by image analysis.

