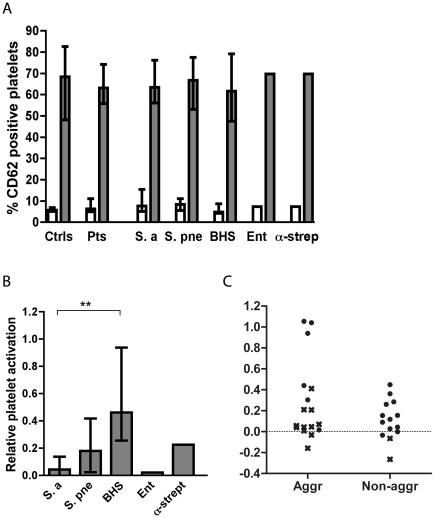
Figure 2. Platelet activation in healthy controls and in patients.
(A) Platelet activation in healthy controls (ctrls), in all patients (pts), and in patients grouped by their respective infective organism. Platelet activation is shown as the percentage of CD 62-positive platelets in response to buffer only (open bars) or to ADP (grey bars). In (B) the increase in activated platelets in response to different bacterial isolates compared to buffer relative to the increase caused by stimulation by ADP compared to buffer is shown. Values are expressed as medians ± interquartile range. *P<0.05 after Mann-Whitney U testing. In (C) the percentage of CD 62-positive platelets in response to bacteria in patient blood is shown in two groups. To the left, patients responding with platelet aggregation to the bacterium are shown and to the right patients not responding with aggregation to the bacterium are depicted. Crosses represent S. aureus, while filled circles represent other bacteria. The difference between the groups is significant only if the results obtained with the S. aureus isolates are excluded.

