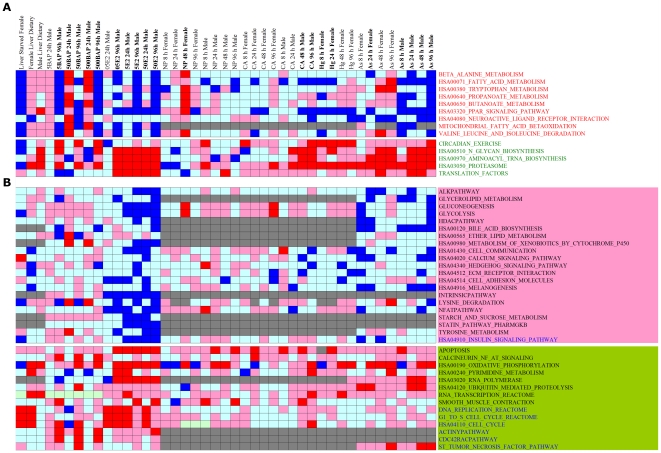
Figure 3. Meta-activity profiles of anti-correlated molecular pathways across 43 chemical perturbations.
(A) Red and green fonts indicate hubs of Group A and B, respectively. Red and blue shades denote activation and suppression of pathways, as indicated from their respective NES scores, respectively. Darker shades correspond to their respective colors denote significant responds. Bolded sample labels are those conditions showing inverted activity profiles for hubs in Group A and B. (B) Meta-activity profiles of non-hub pathways showing anti-correlated behavior. Pathways in pink and green boxes are non-hub pathways with high anti-correlation scores associated to Group A and B, respectively (See Materials and Methods for detail description). Blue fonts are “outliers” pathways as discussed in the text. As = Arsenic (V); BAP = Benzo-[a]-pyrene; CA = Chloroaniline; E2 = Estradiol; Hg = Mercury (II) chloride; NP = 4-Nitrophenol. 8 h, 24 h, 48 h, and 96 h denote chemical exposure period for 8, 24, 48, and 96 hours, respectively.

