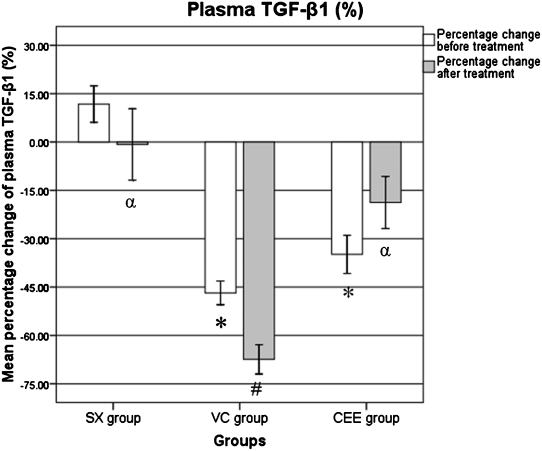
Figure 2.
The percentage change differences in the plasma TGF-β1 level. SX, sham-operated group given normal saline for six weeks; VC, ovariectomized control group given normal saline for six weeks; CEE, ovariectomized group treated with conjugated equine estrogen (100 µg/kg/day) for six weeks; n = 10. * Significant difference when compared with the sham group (p<0.001). # Significant difference when compared with the BT-BL within the same group (p = 0.045). α Significant difference when compared with the VC group (p = 0.001).

