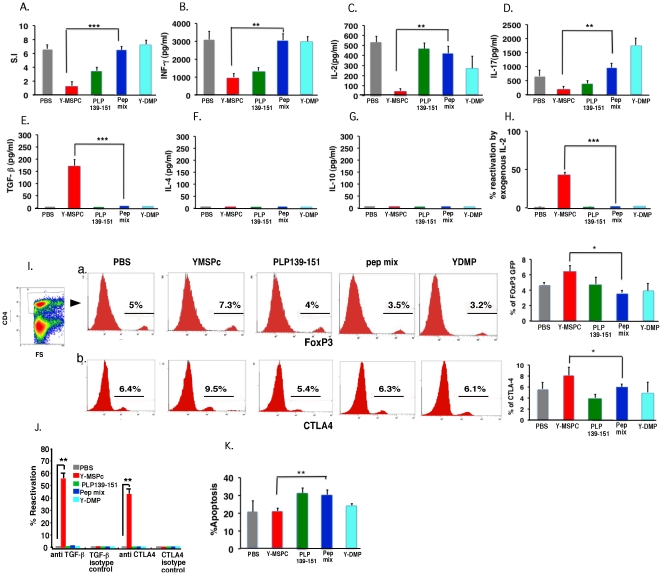
Figure 4. Analysis of the efficacy of anti-PLP peripheral regulatory mechanisms induced by treatment with Y-MSPc vs. single PLP peptide or peptide mixture (huPEP mix).
(C57Bl.FoxP3GFPxSJL/J)F1 mice were immunized s.c. with PLP139-151 (100 µg) in CFA. On day 3, 5, and 7 post immunization, mice (n = 3/group) were injected i.v. with YMSPc (75 µg/mouse), PLP139-151 (100 µg/mouse), huPEP mix (total 140 µg/mouse), Y-DMP (75 µg/mouse), or with 0.5 µl PBS. The huPEP mix contained 1∶1 ratios of phPLP139-151, phPLP175-194, phMOG34-56, phMBP89-104, phMOBP15-36, phOSP55-80 and phOSP186-205 (20 µg each peptide), representing the major encephalitogenic epitopes of five human myelin proteins. A control treatment with non-relevant recombinant protein (Y-DMP) was also included to exclude the possibility that residual bacterial contaminants contributed to the efficacy of Y-MSPc. (Y-DMP is a diabetes mellitus-related recombinant artificial protein encompassing selected multiple epitopes of several antigens related to diabetes; The Y-DMP was constructed, expressed and purified similar to Y-MSPc). Three days later (10 days after immunization), draining LN cells from each treatment group were pooled and analyzed for: (A), Ex vivo recall proliferative response to PLP139-151. The LN cells from each treatment group were cultured for 72 h in microtiter wells in triplicates (0.5×10⁶/well) in the absence or presence of PLP139-151 (5 µg/ml ). [H3]Thymidine was added for the last 18 h. ( B–G ), Secretion of pro-inflammatory (B–D) and anti-inflammatory (E–G) cytokines. LN cells from each treatment group were cultured (5×10⁶/ml ) in triplicate cultures in the absence or presence of PLP139-151 (5 µg/ml ) for 48 h, and the supernatants were collected for measuring the secreted INF-γ, IL-2, IL-17, TGF-ß,, IL-4 and IL-10 cytokines by ELISA. For each treatment group, the net values are presented (after subtracting the values obtained in control cultures without PLP peptide). (H), Ex-vivo recall proliferative response to PLP139-151 in the presence of exogenous IL-2. LN cells from the different treatment groups were cultured in microtiter wells in triplicates without or with PLP139-151 (5 µg/ml) [as in (A)] and in the absence or the presence of exogenous rIL-2 (3.5 U/ml) for 72 h, with [H3]Thymidine added for the last 18 h. Calculating % reactivation: For each treatment group, the S.I. calculated for the recall proliferative response in the presence of exogenous IL-2 was divided by the S.I. calculated in the absence of exogenous IL-2. (I), Flow cytometry of regulatory T-cells induced following systemic administration of YMSPc, PLP139-151, huPEP mix, Y-DMP, or PBS. Draining LN cells from different treatment groups were co-stained with anti-CD4-APC and anti-CTLA-4-PE. The percentage of the FoxP3 (a) or CTLA-4 (b) expressing cells on gated CD4+ cells is shown. The FACS histograms are from one representative experiment, and the panels at the right end of Ia and Ib are the mean values +/−SD from three independent experiments. (J), Ex-vivo recall proliferative response to PLP139-151 by primed LN cells in the presence of neutralizing anti- TGF-ß, or anti-CTLA-4 antibodies. Draining LN cells from the different treatment groups were cultured without or with PLP139-151 (5 µg/ml) [as in (A)] and without or with added neutralizing antibodies anti- TGF-ß, or anti-CTLA-4 (10 µg/ml), or respective isotype control antibodies. Calculating % reactivation: The S.I. calculated for the recall proliferative response in the presence of neutralizing antibodies or the respective isotype control antibodies was divided by the S.I. of the recall response in the absence of neutralizing or isotype control antibodies, respectively. (K), Percent apoptotic cells in CD4+ T cell population of different treatment groups. Apoptosis was determined by FACS analysis of Annexin V/7-AAD staining on gated CD4+ cells. The data presented in A, H, I (the panels a and b at the right end), J, and K, are the mean values from three independent experiments. Data presented in B–G are the mean +/−SD of triplicate cultures of pooled LN cells from one experiment representative of three independent experiments showing a similar pattern. The significance of the effect of Y-MSPc treatment compared to PBS control treatment was p = 0.0003 in A; p = 0,001 in B: p = 0.0001 in C: p = 0.02 in D: p = 0.0002 in E: p<0.00001 in H; p = 0.03 in Ia: p = 0.04 in Ib; and p = 0.05 in K. The significance of the effect of Y-MSPc treatment compared to huPEP mix treatment: *, p<0.05; **, p<0.005; ***, p<0.0005 (two tailed Student's t-test).

