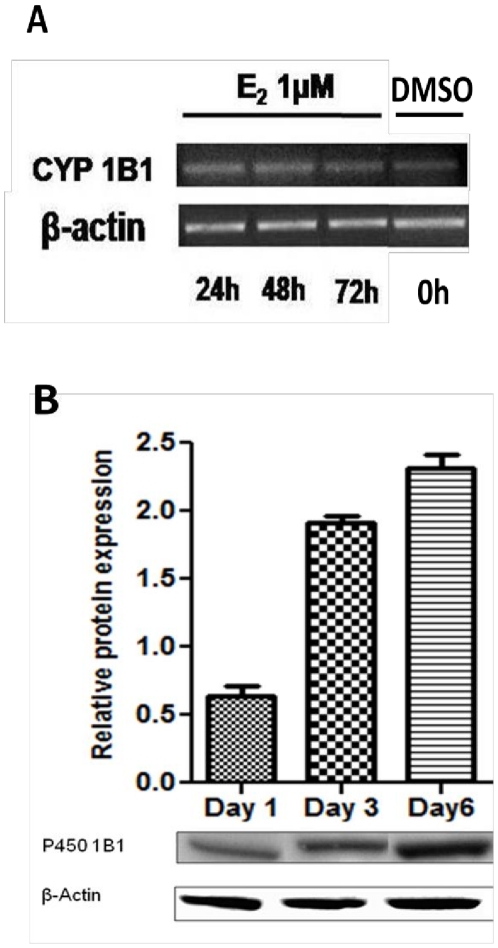
Figure 3. Induction of CYP450 1B1 expression in MCF-10A cells by E2 (1 µM).
Cells were collected at different time points (24 h, 2, 3 and 6 days). Increased CYP450 1B1 mRNA levels A. from E2 treatment measured with real-time PCR, correlate with protein levels B. extracted and analyzed by western blot using anti CYP450 1B1 rabbit polyclonal primary antibody. Representative blots are shown of the 55 kDa immunoreactive band. Intensity of the bands was normalized to β-actin (N = 6) showing mean and s.e.m.

