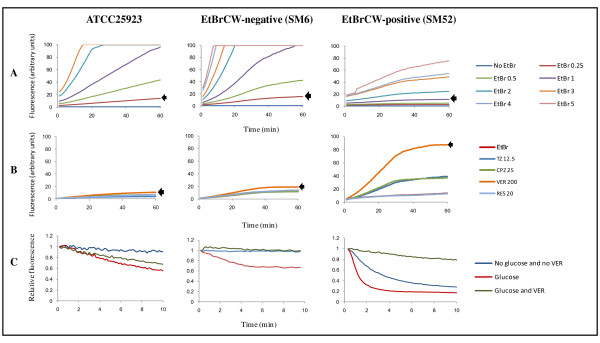
Figure 1.
Real-time EtBr accumulation/efflux for the representative strains ATCC25923 (reference), SM6 (EtBrCW-negative) and SM52 (EtBrCW- positive). Panel A: Assessment of EtBr accumulation. The arrow indicates the EtBr accumulation at the concentration (mg/L) chosen for the subsequent assays (panels B and C). Panel B: Assessment of EtBr accumulation in the presence of efflux inhibitors. The EIs were tested at a sub-inhibitory concentration, namely TZ: thioridazine (12.5 mg/L); CPZ: chlorpromazine (25 mg/L); VER: verapamil (200 mg/L) and RES: reserpine (20 mg/L). The arrow indicates the EtBr accumulation in the presence of the most effective EI for each isolate. Panel C: Assessment of EtBr efflux. The assays were done in the presence/absence of 0.4% glucose, with or without the EI verapamil (VER) at a sub-inhibitory concentration of 200 mg/L. The data presented was normalized against the data obtained in conditions of no efflux (absence of glucose and presence of 200 mg/L of VER).

