Figure 1.
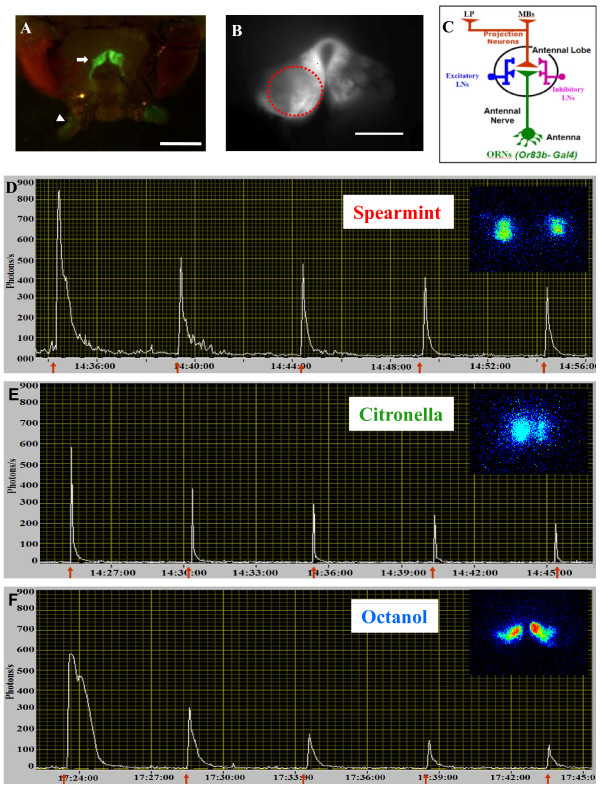
Odor-induced Ca2+-responses in axon terminals of ORNs of a control fly (Or83b,GA/CS). (A) Combined dim-light and fluorescence images showing the ORNs in the antennae (arrowhead) and their synaptic terminals (arrow) in the antennal lobes (Leica MZ FLIII binocular, Scale bar = 100 μm). (B) Fluorescence image of the antennal lobes taken at the beginning of the experiment and used as reference image. The red-dashed circle represents the ROI (Region of Interest) from which the light emission is quantified (Scale bar = 50 μm). (C) Schematic drawing of the local neuronal network in the antennal lobe. Ca2+ -activity is recorded in the axon terminals of the ORNs (in green), LNs: local interneurons, LP: lateral protocerebrum, MBs: Mushroom-bodies. (D,E,F) A representative bioluminescent Ca2+ -activity profile evoked by 5 applications of 5 s odor duration (red arrow) at 5 min-intervals of spearmint (D), citronella (E), octanol (F). Inset: a bioluminescence image (accumulation time: 10 s) of the first odor application for each odor. We remark that the activated region is different for each odor (odor specific). ORNs response adapts to repeated odor stimulation (see also movie in Additional file 1).

