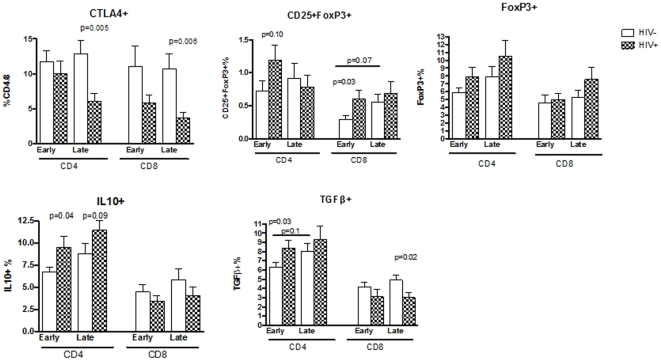
Figure 1. Proportions of Treg in HIV-infected and uninfected women during early and late gestation.
Bars represent means and standard error of the mean (SEM) of data generated by flow cytometric analysis of freshly thawed PBMC. The Treg are expressed as a percentage of the parent CD4+ or CD8+ T cell population. The graph titles indicate the Treg subpopulation depicted in each graph. Significant or marginally significant differences between HIV-infected and uninfected women are indicated by p values immediately above each time point (Mann Whitney). Horizontal lines indicate significant or marginally significant changes between early and late pregnancy. Such changes were detected only in uninfected women.

