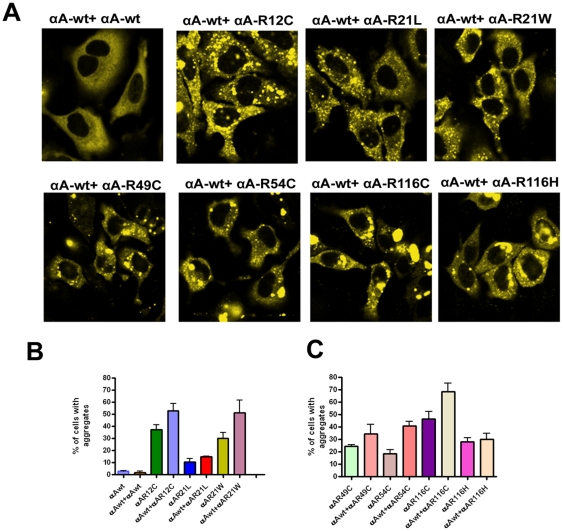
Figure 2. YFP-αA-wt and its mutants were co-expressed with CFP-tagged αA-wt.
A: Laser scanning confocal microscope images. HeLa cells were transfected with 1 µg each of CFP-tagged αA-wt and YFP-tagged mutant constructs. After 48 h transfection, cells were analyzed with confocal microscope. Cells showed more aggregates when co-expressed with αA-wt. The CFP signal was excited at 458 nm and the images were collected by BP 475–525 nm filter, YFP was excited at 514 nm and the images were collected by BP 530–600 nm filter. The images represent one of the four similar images obtained in three independent experiments. B&C: Graph represents per cent of cells with aggregates. Cells were transfected with YFP-tagged αA-wt or mutants and CFP-tagged αA-wt. Cells having aggregates were counted in 10 random fields each field with 30 cells after 48 h transfection. The results were presented as means ± SD obtained in three independent experiments. For αA-wt + αA-R12C: p < 0.03; for αA-wt + αA-R21L : < 0.05; for αA-wt + αA-R21W : < 0.04, for αA-wt + αA-R49C, is not significant; for αA-wt + αA-R54C : < 0.0001; for αA-wt + αA-R116C : < 0.01 and for αA-wt + αA-R116H, is not significant.

