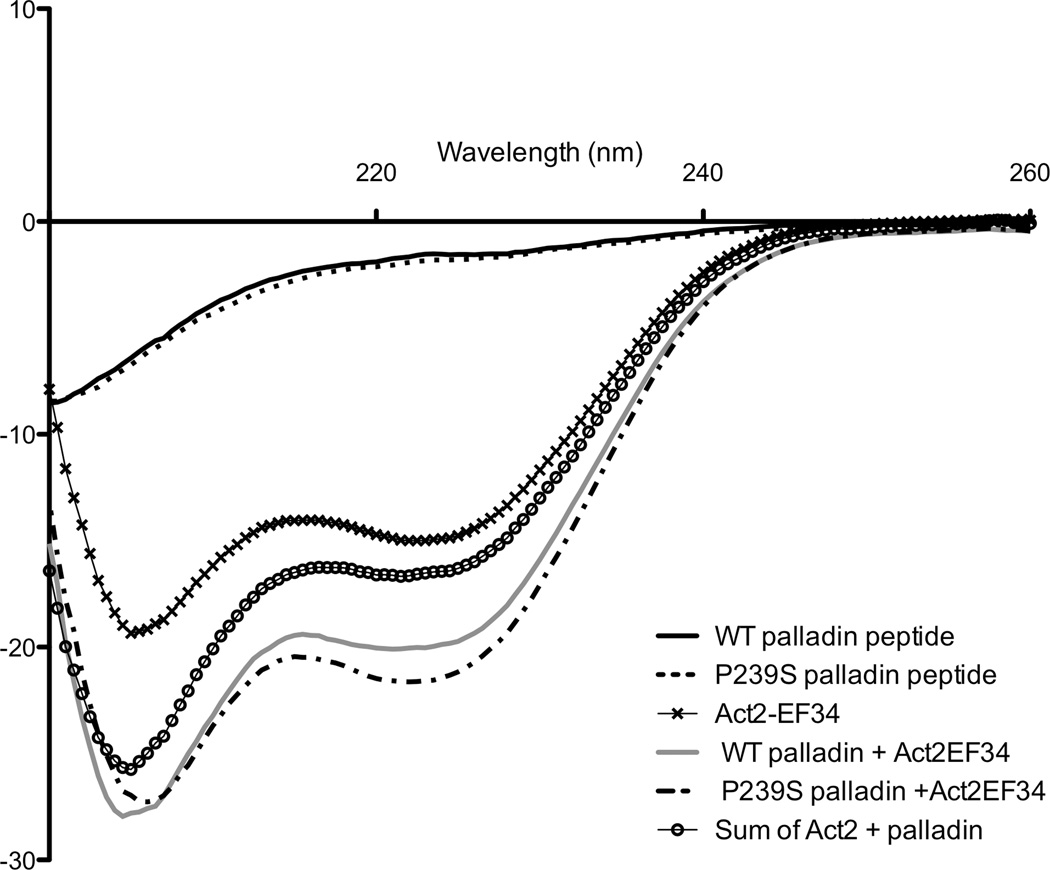
Figure 2.
Gain of signal for the Act-EF34/palladin complex recorded by far-UV CD spectroscopy. The concentration of each component was 20 µM, and the path length was 2 mm. The spectra of the isolated components, WT palladin (—), FX palladin (- -), Act2-EF34 (✕), WT complex (—), and FX complex (–·-) are shown. The sum of the spectra for the isolated Act-EF34 and palladin peptide is also reported for comparison (○).

