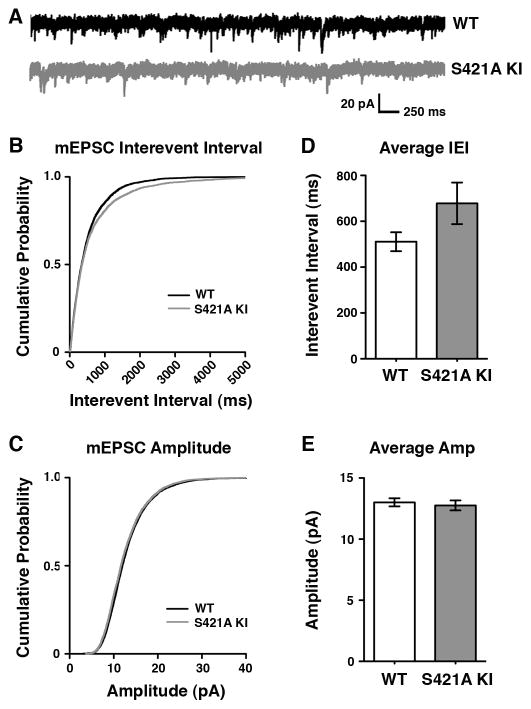
Figure 4. Analysis of mEPSCs in the MeCP2 S421A Knock-In Mouse.
(A) Representative traces of mEPSCs recorded from layer II/II V1 pyramidal neurons in P16–17 MeCP2 S421A knock-in mice or their wild-type littermates.
(B–C) Cumulative probability distributions of mEPSC interevent intervals (B) or amplitudes (C) recorded from MeCP2 S421A or wild-type littermates.
(D–E) Average interevent interval (D) and ampltitude (E) of mEPSCs recorded from MeCP2 S421A or wild-type neurons. Data are mean ± SEM, p = 0.1 by Student’s t-test.
Data shown represent 250 random events drawn from each of the wild-type (n=23) or MeCP2 S421A knock-in (n=25) cells analyzed, recorded from 6 pairs of littermates.

