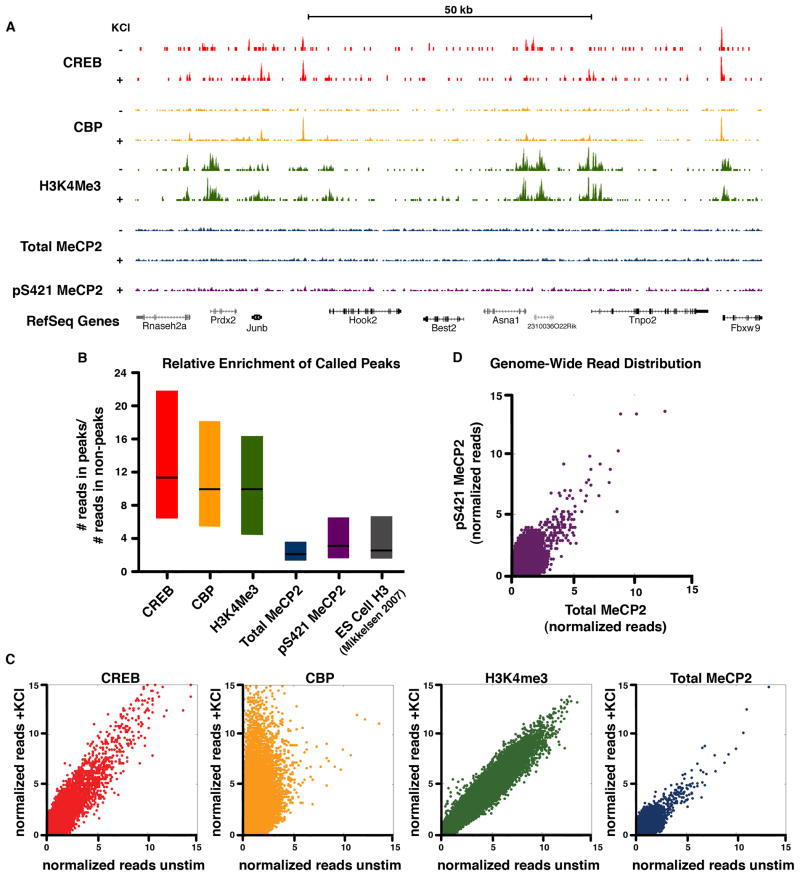
Figure 6. ChIP-Seq analysis reveals a histone-like binding profile for total MeCP2 and global phosphorylation of MeCP at S421 upon neuronal stimulation.
(A) ChIP-Seq profiles for total and pS421 MeCP2 as well as CREB, CBP and H3K4me3 (Kim et al., 2010) across a representative genomic region. ChIP samples were isolated from E16 + 7 DIV cortical cultures, unstimulated (‘−‘) or stimulated for 2 hr with 55mM KCl (‘+’). The location of RefSeq genes, including the activity-regulated immediate-early gene Junb, are indicated.
(B) Box plots (1st quartile, median, and 3rd quartile) displaying the ratio of the number of reads found at called peaks versus non-peak control regions are shown for each ChIP-seq data set (2hr KCl stimulated). Enrichment for pan-histone H3 ChIP-Seq peaks from embryonic stem cells is shown for comparison (H3ES, Mikkelsen et al., 2008).
(C) Scatter plots depict normalized ChIP-Seq reads from E16 + 7 DIV cortical cultures for 1000 bp windows tiled across the genome before and after stimulation (2hr KCl). Data points on the diagonal indicate no substantial change in ChIP signal upon stimulation. Points located off the diagonal, as seen for CBP, indicates dynamic change in response to neuronal activity.
(D) Scatter plot depicts normalized ChIP-Seq reads of pS421 MeCP2 versus total MeCP2 from stimulated dissociated cortical cultures (E16 + 7 DIV, 2 hr KCl) for 1000 bp windows tiled across the genome. Distribution along the diagonal indicates that the profile of pS421 reads tracks with total MeCP2 reads across the genome.

