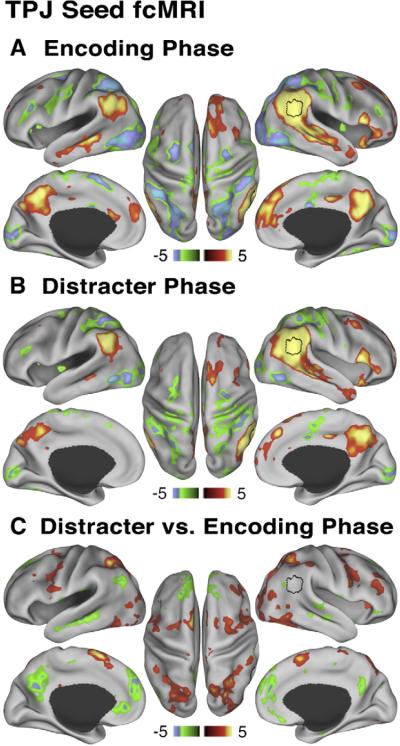
Fig. 6.
Relationship between TPJ and default network at encoding and distracter phases. All maps are shown using Z statistics. (A) During the encoding phase TPJ seed ROI shows positive correlations (red-yellow colors) with main nodes of the default network and negative correlations (green-blue colors) with main components of the dorsal task network. (B) During the distracter phase the pattern is similar, but attenuated. (C) Maps show results of a paired t-test comparing TPJ ROI trial-based connectivity during distracter vs. encoding phase. Red-yellow map shows regions where correlations with the TPJ seed increased from encoding to distracter phase, whereas the green-blue map shows regions where correlations with the TPJ seed decreased from encoding to distracter phase, indicative of “de-coupling”. We show the map at Z>2.5 to illustrate that the TPJ (shown in black border outline) “de-couples” mainly from the default network and not other cortical regions, but `couples' more strongly with the dorsal task network. All peaks shown were present after applying a multiple comparison correction using cluster size algorithms to ensure whole-brain false positive rates of p<0.05.

