
Figure 2.
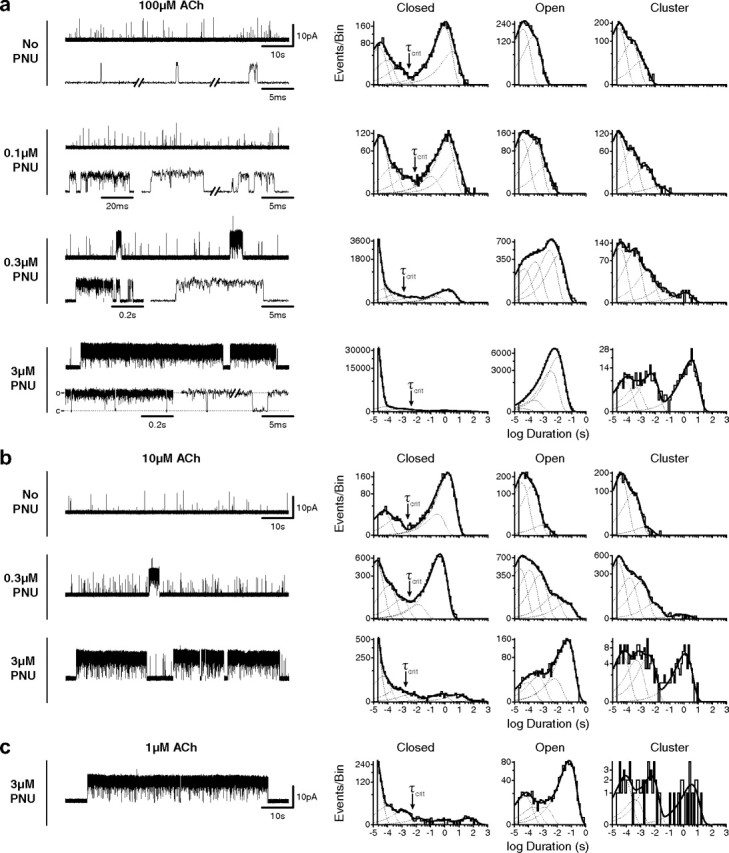
Single-channel traces and dwell time histograms for wild-type α7 in the presence of increasing concentrations of PNU in the pipette solution. Recordings were made in the cell-attached patch configuration at an applied potential of −70 mV. Currents activated by 100 μm (a), 10 μm (b), and 1 μm (c) ACh are all shown at a bandwidth of 5 kHz, with channel openings as upward deflections. Corresponding histograms of dwell times are shown on logarithmic time axes with overlaid fits to the sum of exponentials (solid line, fits; dotted lines, individual components). Cluster duration histograms (far right) are open time histograms generated by summing open times with flanking closings briefer than a critical time (τcrit, indicated by arrows) determined from corresponding closed time histograms (see Materials and Methods).