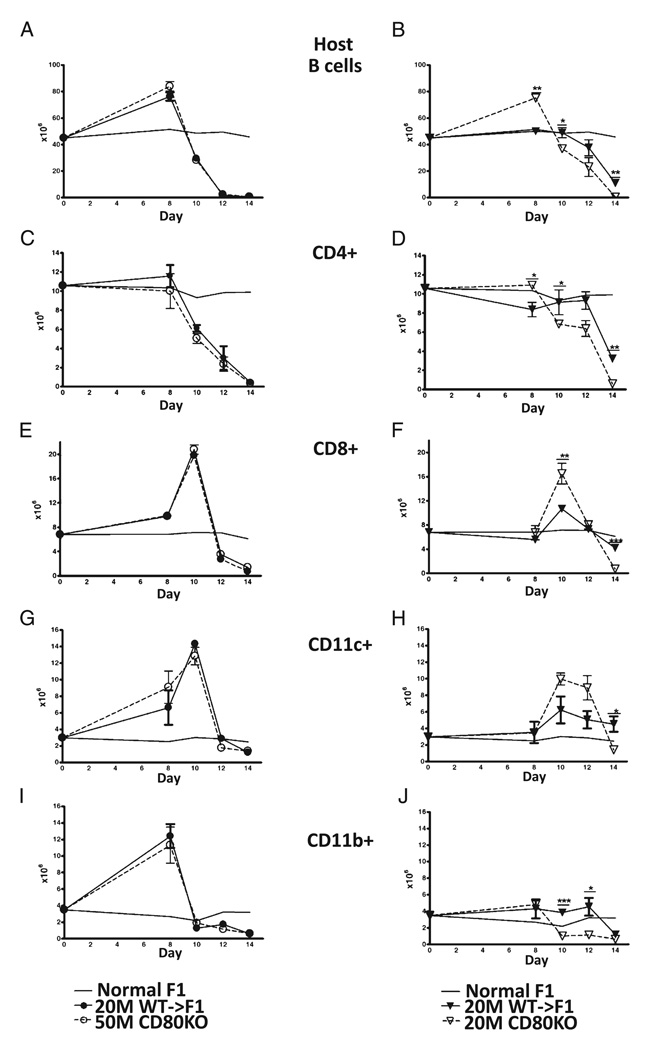
FIGURE 4.
CD80 KO→F1 mice exhibit enhanced acute GVHD phenotype only at a suboptimal donor cell dose. Host splenocyte populations were determined by flow cytometry on the same F1 cohorts described in Fig. 3. Results are shown for: host B cells (A, B), host CD4+ cells (C, D), host CD8 T cells (E, F), host DCs (CD11c+) (G, H), and host macrophages (CD11b+) (I, J). Results for optimal dosing are shown in A, C, E, G, and I and suboptimal dosing in B, D, F, H, and J. Symbols are as described in Fig. 3. For comparison, the mean values of uninjected age-and sex-matched BDF1 mice (n = 5) tested simultaneously with the experimental groups are shown for each time point (solid line, no symbols), and SEMs have been omitted from this line. p values compare the same dose of WT→F1 versus KO→F1 at a given time point. *p < 0.05; **p < 0.01; ***p < 0.005.

