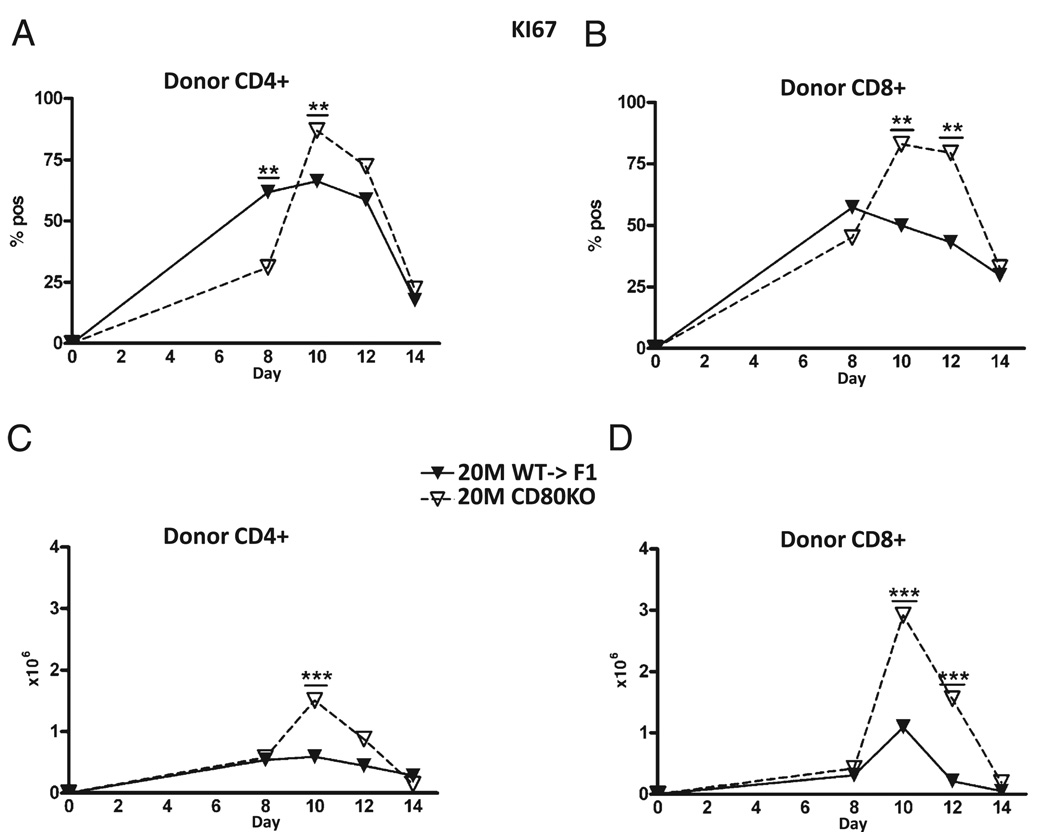
FIGURE 6.
CD80 KO→F1 mice exhibit significantly greater numbers of proliferating donor CD4 and CD8 T cells at the suboptimal dose. The experimental protocol is as outlined for Fig. 3. F1 mice received 20 × 106 WT or CD80 KO splenocytes, and the percentage (A, B) or numbers (C, D) of KI-67 positive cells shown for donor CD4 (A, C) and CD8 (B, D) T cells are shown as group mean ± SE. **p < 0.01; ***p < 0.005.

