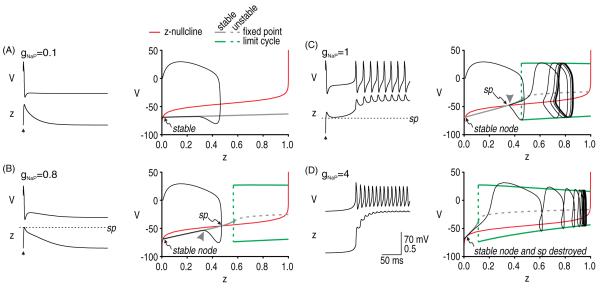
Figure 3.
Initiation of afterdischarge by a single perturbation. The question of whether afterdischarge is initiated for a given parameter set was addressed by breaking the questions into two parts: (1) How strongly must gNaP be activated in order to sustain repetitive spiking? (2) How strongly is gNaP actually activated? The first question was addressed by converting z from a variable to a parameter (thus reducing the model to two dimensions) and systematically varying z as a bifurcation parameter to determine at what point the V–w system undergoes a bifurcation. The second question was addressed by projecting the V–z trajectory from the original 3D model onto the bifurcation diagram from the 2D model. The z-nullcline (red) is also projected onto the bifurcation diagram in order to identify the saddle point (sp). Different values of gNaP (indicated in mS cm−2) were tested in A–D; in all cases, gNa = 20 mS cm−2. (A) For gNaP = 0.1 mS cm−2, the bifurcation diagram shows that no amount of activation can produce repetitive spiking, i.e. there is no bifurcation for z ≤ 1. (B) For gNaP = 0.8 mS cm−2, the bifurcation diagram indicates that repetitive spiking occurs for z > 0.57, but the superimposed trajectory shows that z does not rise that high following a single evoked spike; specifically, the V–z trajectory approaches the stable branch of the bifurcation diagram on the near side of the saddle point (arrowhead), whereupon the trajectory is directed back to the stable fixed point. Compare with trajectory in C. (C) For gNaP = 1 mS cm−2, the bifurcation diagram indicates that repetitive spiking occurs for z > 0.45. The superimposed trajectory shows that z does indeed rise high enough to produce that bifurcation in the 3D model. Sustained activation of gNaP is predicted by the V–z trajectory approaching the stable branch of the bifurcation diagram on the far side of the saddle point (arrowhead), which allows z to continue increasing. (D) For gNaP = 4 mS cm−2, the bifurcation diagram shows that the stable fixed point defining the ‘quiet’ attractor is destroyed, which allows the system to move to its other (now sole) ‘active’ attractor even in the absence of any perturbation. Modified from Coggan et al (2010).

