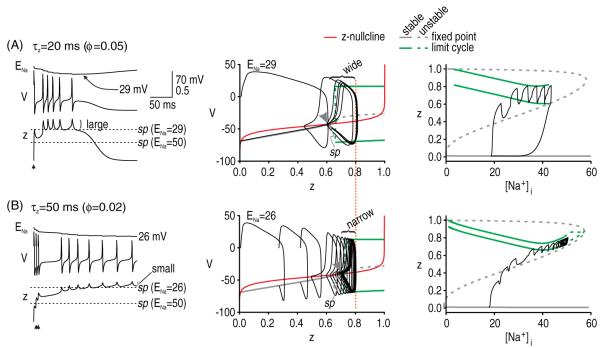
Figure 6.
Kinetics of gNaP affect traversal of the saddle point. (A) When the kinetics of gNaP are relatively fast, z increases rapidly during each spike but so too will it decrease rapidly after each spike. As the saddle point creeps rightward as ENa decreases, large post-spike dips in z increase the likelihood of the V–z trajectory crossing back over the saddle point. Compare with B. (B) When the kinetics of gNaP activation are slowed down, z changes more slowly. Consequently, initiation of afterdischarge required three spikes evoked in quick succession (5 ms intervals) to drive z across the saddle point. However, once initiated, afterdischarge did not terminate (despite an even larger reduction in ENa than in A), consistent with the smaller dips in z. For both A and B, gNa = 30 mS cm−2 and gNaP = 0.8 mS cm−2. Note that peak gNaP activation was equivalent in both cases (dotted orange line). Bifurcation diagrams on the right show that [Na+]i can rise higher without terminating afterdischarge for conditions in B. Note the spacing between the maximum and minimum of the limit cycle, as shown on these bifurcation diagrams.

