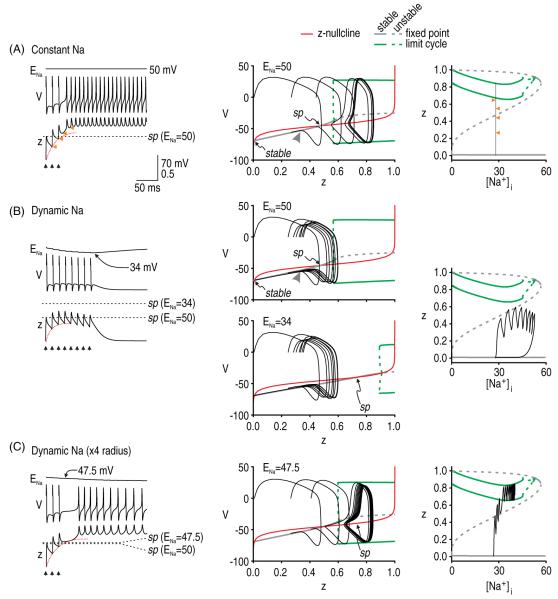
Figure 7.
Intracellular Na+ accumulation affects afterdischarge initiation when initiation depends on repeated perturbations. In all panels, gNa = 20 mS cm−2 and gNaP = 0.8 mS cm−2 and stimuli were repeated at 15 ms intervals, as indicated by the arrowheads. (A) When ENa is constant, the only requirement for initiating afterdischarge is that repeated perturbations cause cumulative activation of z (red dotted line on time series) such that the V–z trajectory eventually crosses the stationary saddle point. Bifurcation diagram on right shows how z increases with each evoked spike without a concomitant increase in [Na+]i; arrows point to values to which z falls after each spike (compare with time series). (B) However, if the saddle point shifts on the same time scale as cumulative activation of z, then the Na+ accumulation caused by each evoked spike can push the saddle point away faster than each spike can increase z, resulting in the V–z trajectory never overtaking the shifting saddle point, as seen here. (C) Increasing the surface area-to-volume ratio of our simulated compartment by increasing the radius from 0.5 to 2 μm reduced the rate of Na+ accumulation. Under these conditions, spikes evoked at 15 ms intervals were capable of initiating afterdischarge. Note that z-[Na+]i bifurcation diagrams are the same in parts A–C and that the only difference, therefore, is in the trajectory. These results highlight that it is the relative rates of g activation and Na+ NaP accumulation that are important, as opposed to the absolute rates.

