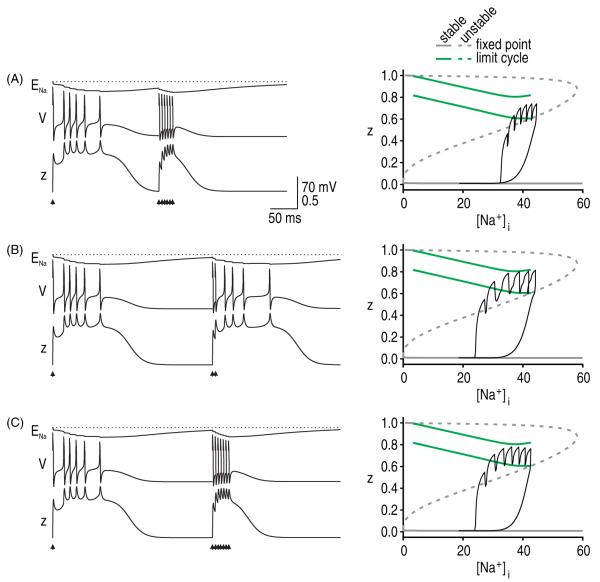
Figure 8.
Slow Na+ kinetics cause a refractory period. All simulations are with gNa = 30 mS cm−2 and gNaP = 0.8 mS cm−2. (A) A burst of six spikes evoked at 5 ms intervals could not elicit a second afterdischarge when that burst arrived 200 ms after the start of the first afterdischarge. Response to second stimulus set is projected onto the z versus [Na+]i bifurcation diagram. For these conditions, the z-trajectory fails to stay above the saddle point branch and enter the limit cycle. (B) When delivered 300 ms after the first start of the first afterdischarge, only two spikes evoked at 5 ms intervals were required to elicit afterdischarge, although this is still more than the single spike required to elicit the first afterdischarge. Patterns in A and B are indicative of a refractory period. Notably, the model is refractory to afterdischarge but can support spike generation, as evidenced by the evoked spikes. (C) Evoking multiple spikes may, by causing a large rise in [Na+]i, mask an afterdischarge that would have been elicited by fewer evoked spikes.

