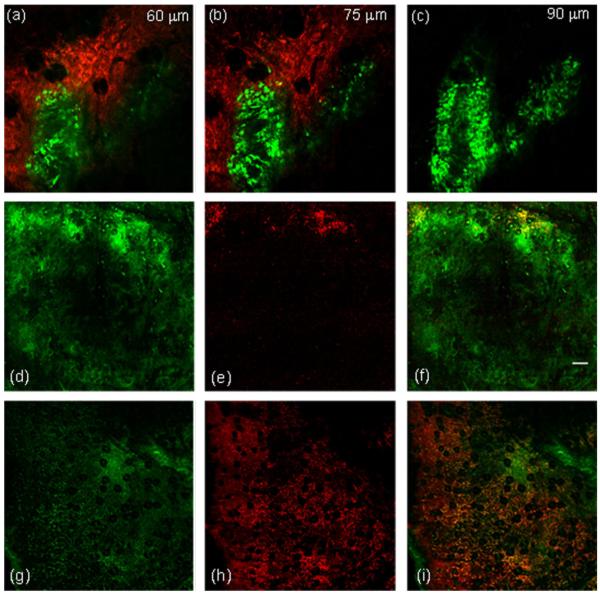
Fig. 9.
In vivo two-color confocal images of hsp70 promoter-induced GFP fluorescence (green) and extracellular HSP70 (red) in an hsp70-GFP/EMT6 tumors subjected to mTHPC-PDT. Extracellular HSP70 was labeled using a PE-conjugated antibody against HSP70. a–c: Tumors irradiated with 4 J cm−2 and imaged 24 hours after irradiation. The images were acquired from the same FOV at three different tissue depths of 60, 75, and 90 μm in the tumor. The optical section thickness, the in-plane resolution, and the FOV in the image are 6 μm, 1 μm/pixel, and 800 μm × 800 μm, respectively. d–f: In vivo confocal fluorescence images of hsp70-GFP/EMT6 tumors subjected to 0.1 J cm−2 and (g–i) 10 J cm−2, and imaged 24 hours after irradiation. d and g: hsp70-driven GFP expression and (e and h) the distribution of extracellular HSP70. The merged images in (f and i) display the overlay of the GFP (green) and extracellular HSP70 (red) images. The FOV imaged in both of these tumors is 2.4 mm × 2.4 mm, constructed from a montage of nine individual 800 μm × 800 μm fields. The scale bar represents 200 μm.

