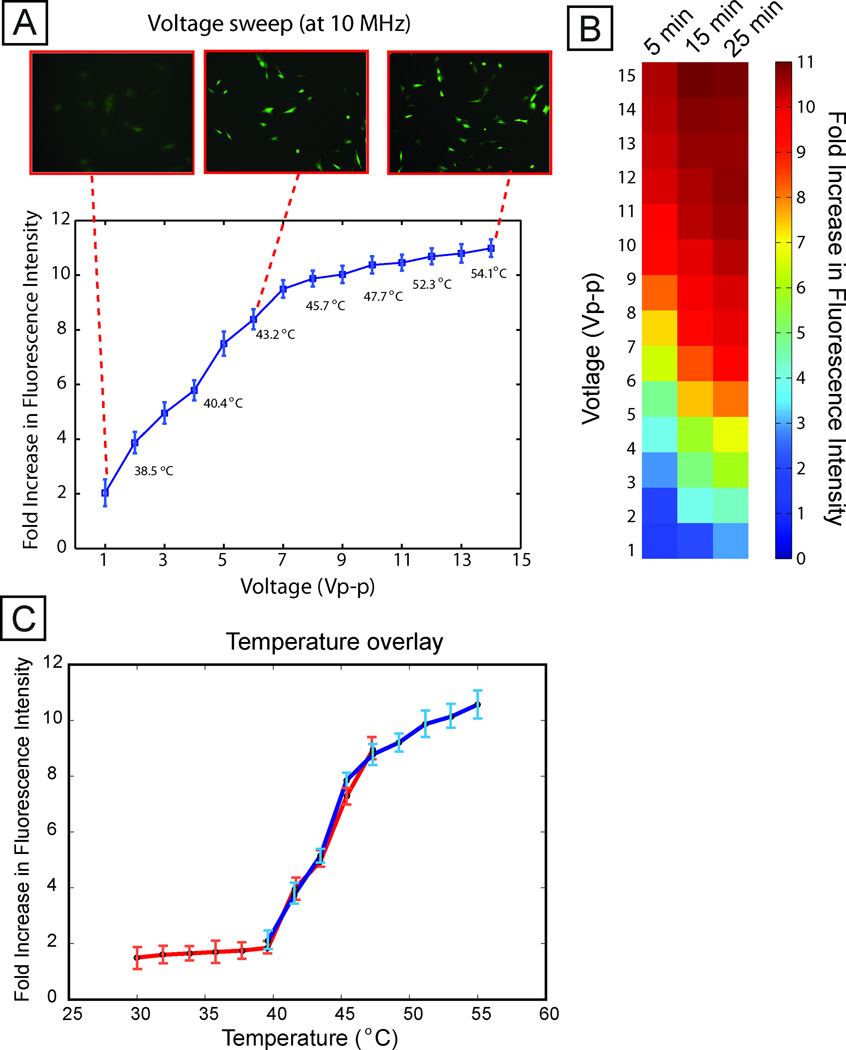
Fig. 3. Voltage sweep.
(A) Average per-cell fluorescence intensity (normalized to unexposed controls) across varying voltage, at 1 MHz and 15 min stimulation duration, showing that stress activation increases with applied voltage. Numbers in the plot correspond to measured temperatures in each chamber. Images show representative GFP fluorescence at low, medium, and high voltage. Error bars represent standard deviation across three independent experiments. A 1 V exposure corresponds to a field of 8e3 V/m. (B) A heat map showing a voltage sweep for different durations of field exposure. Longer durations of exposure show increased cellular stress levels. (C) Temperature overlay. Plots of temperature correlated to fluorescence intensity for voltage sweeps performed at 37 °C (blue line) and 30 °C (red line). Error bars represent standard deviation across three independent experiments.

