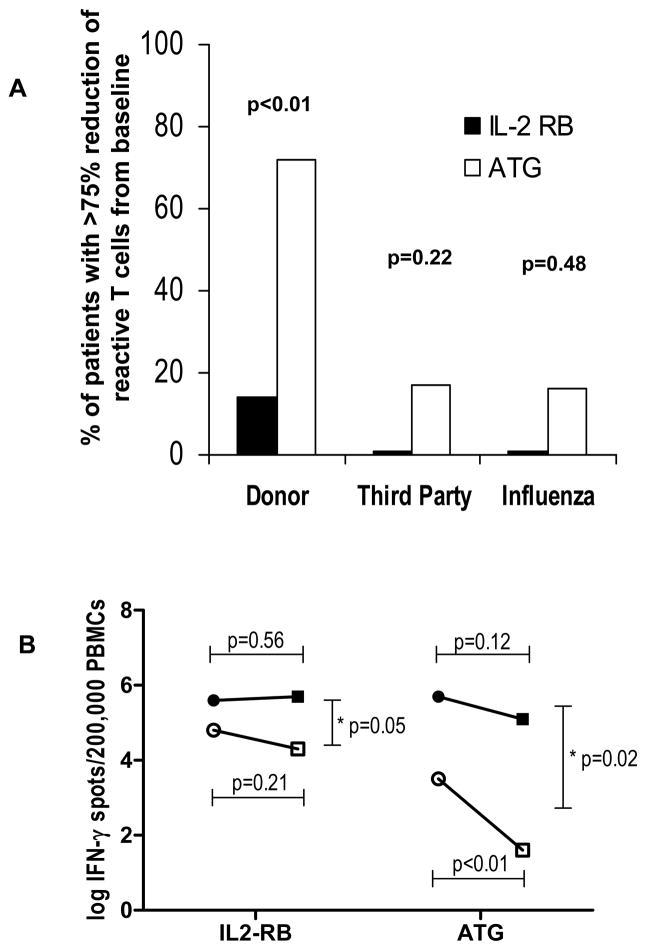
Figure 4.
Graph showing the percent of transplanted subjects with at least a 75% decline in frequencies of donor HLA, third party HLA and influenza reactive T cells from baseline at 6 month follow up (Figure 4A). Change of IFN-γ producing PBMCs from baseline (circles) to 6 months post-transplant (squares) for anti-donor (clear marks) and third party (solid marks). *Mean change between anti-donor and anti-third party alloreactivity.

